



Know the odds on your finish date.
Monte Carlo schedule and cost risk analysis run on the real network. You get P50, P80 and P90 dates, the risks driving them, and the time and contingency worth holding.
One date hides the spread.
A single printed finish
CPM gives one date. It is one point in a range of outcomes, and usually one of the optimistic ones.
Merge points cut the odds
Where several near-critical paths meet one milestone, the chance of hitting it falls quickly. A deterministic schedule cannot show that.
Contingency as a round number
Without a model, schedule and cost buffers are guesses. They run dry early or sit untouched at closeout.
How we model risk.

- 01
Repair the network first
Open ends and hard constraints distort every iteration, so a health check and repairs come before any simulation.
- 02
Ranges from the people who own the work
Short interviews with engineers and superintendents set three-point durations for the activities that matter.
- 03
Risks as named events
A late transformer, a failed inspection, a wet season. Each risk is mapped to the activities it hits, with likelihood and impact.
- 04
Thousands of iterations
The model returns P50, P80 and P90 dates and costs for each milestone, plus how often each path turns critical.
- 05
Rank mitigation by days bought
Sensitivity results show which risks move the P80 most, so mitigation money goes where it buys time.
What you walk away with.
Scoped to your project. Native files and plain-English outputs that stay yours when we leave.
P50, P80 and P90 dates for key milestones, and the confidence level of your current target stated in one sentence.
A cost range and contingency recommendation at the confidence level you choose, tied to named risks.
The short list of risks and activities behind most of the uncertainty in the finish.
Specific actions with owners and dates, and the effect each one has on the P80 date.
The risk-loaded schedule and every input, so your team can rerun the model as the project moves.
When to call us.
The earlier we see the schedule, the more options you keep.
Before a date goes public
A board, lender or tenant is about to hear a finish date. Know its odds first.
At a funding gate
Contingency has to be set, and the figure needs a basis someone can defend.
After a major change
Scope, sequence or delivery method changed, and the old confidence level no longer holds.
When paths converge
Several workstreams feed one milestone and float is thinning on all of them at once.
Where this work has run.
Every project is confidential. Names describe the work, not the client.
 Data Centers · IllustrativeHyperscale Data Hall Commissioning ControlsReady for service meant Level 5 testing done, not a finished building. We scheduled every hall to that standard.
 Oil, Gas & Chemicals · IllustrativeChemical Plant Turnaround ScheduleEvery outage day is lost production. The turnaround was tracked by shift and handed back a day ahead of plan.
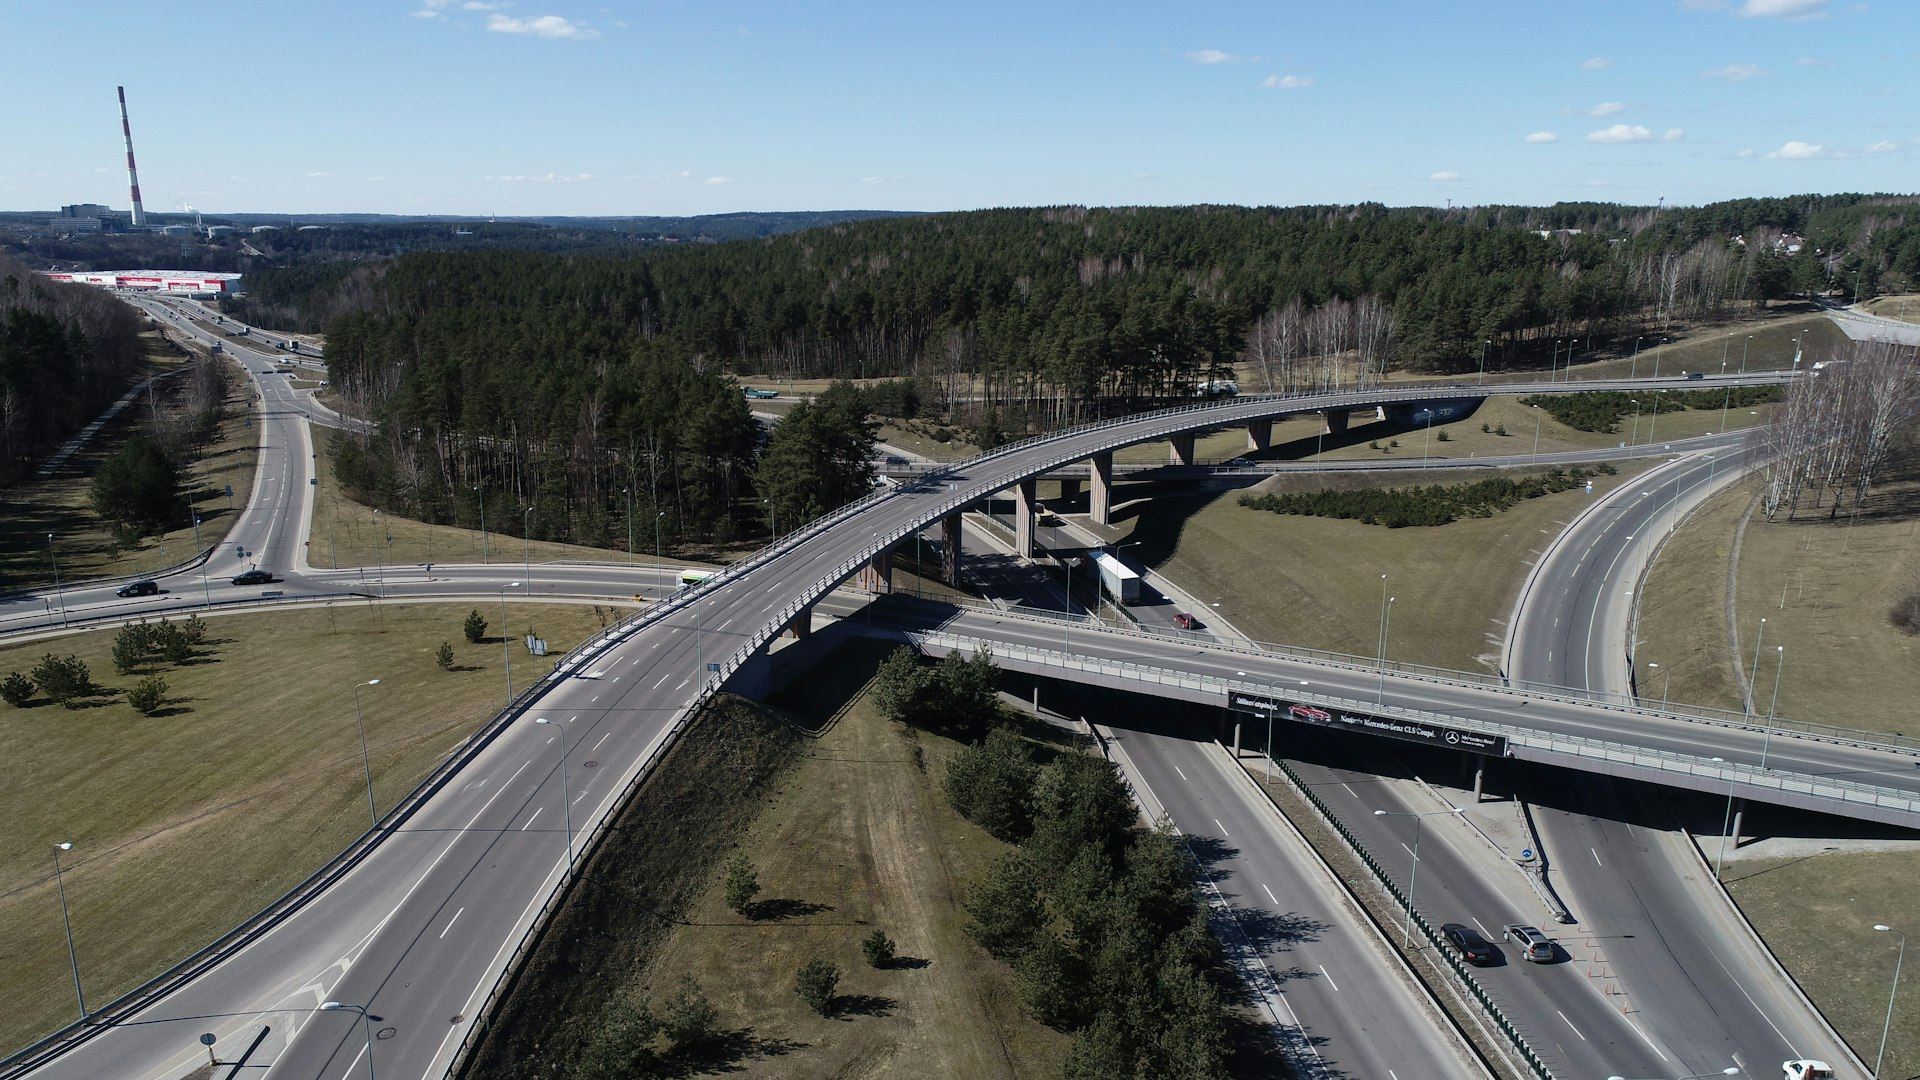 Transportation · IllustrativeHighway Widening Owner Schedule ReviewThe agency needed someone to test a design-builder's monthly updates. We review each one before it is accepted.
Straight answers to fair questions.
What is a P80 date?
The date the model gives an 80 percent chance of meeting or beating. Many owners commit to the P80 rather than the deterministic finish.
Is this worth it on a smaller project?
Often, when a single milestone carries heavy cost or penalties. The model is scaled to the decision it supports.
Does the schedule need to be perfect first?
No, but the logic must be sound. We repair what would distort the results and tell you exactly what we changed.
Can we see how it works?
Try Finish-Date Confidence in our Controls Lab. It runs a Monte Carlo on a sample network in your browser.
Related services.

Send the schedule. Act while you have options.
Share the project, the latest XER and the date you are protecting. We will tell you plainly what the schedule is telling you.