


Know what is driving your finish.
Critical path analysis that tells you which chain of work controls each milestone this period, how much float sits behind it, and what the team can change now to protect the date.
The wrong path gets the attention.
Managing the loudest problem
Meetings focus on the trade that complains most. The real driver is quietly consuming float somewhere else.
A path that is not real
Constraints, lags and out-of-sequence progress can produce a critical path that does not match anything happening in the field.
Near-critical work ignored
A path with eight days of float becomes critical between updates and catches everyone off guard.
How we read the path.

- 01
Longest path and total float, together
Each view hides different problems. Reading both catches calendar effects, constraints and thin margins that one alone would miss.
- 02
Check the path against the field
Every driving activity is confirmed with the people doing the work. If the field disagrees, the logic gets fixed.
- 03
Watch the near-critical paths
Paths inside a set float threshold are listed and tracked so none turns critical by surprise.
- 04
Trend float erosion
Float on each milestone is plotted update over update. The slide shows up before the date moves.
- 05
Name the decision
Every period ends with the specific actions that would protect the finish, and who has to take them.
What you walk away with.
Scoped to your project. Native files and plain-English outputs that stay yours when we leave.
The path to each key milestone, activity by activity, with float in days and the reason each link drives.
Paths within your float threshold, ranked, with the activities most likely to tip them over.
Total float on each milestone across updates, so the direction is obvious at a glance.
Ties, constraints and progress errors that distort the path, each with the fix.
What to change this period to protect the date, with an owner named for each item.
When to call us.
The earlier we see the schedule, the more options you keep.
The finish keeps moving
Each update shows a later date and nobody can say which work caused it.
The path jumped
The critical path moved to a different area overnight, and the team doubts it is real.
Float is thin everywhere
Several areas are drifting toward zero at the same time.
A milestone carries penalties
A tenant date, an energization window or damages sit at the end of the path.
Where this work has run.
Every project is confidential. Names describe the work, not the client.
 Healthcare · IllustrativeAcute Care Bed Tower Baseline RebuildThe contractor's baseline showed an on-time finish that the logic could not support. We rebuilt it before the owner accepted it.
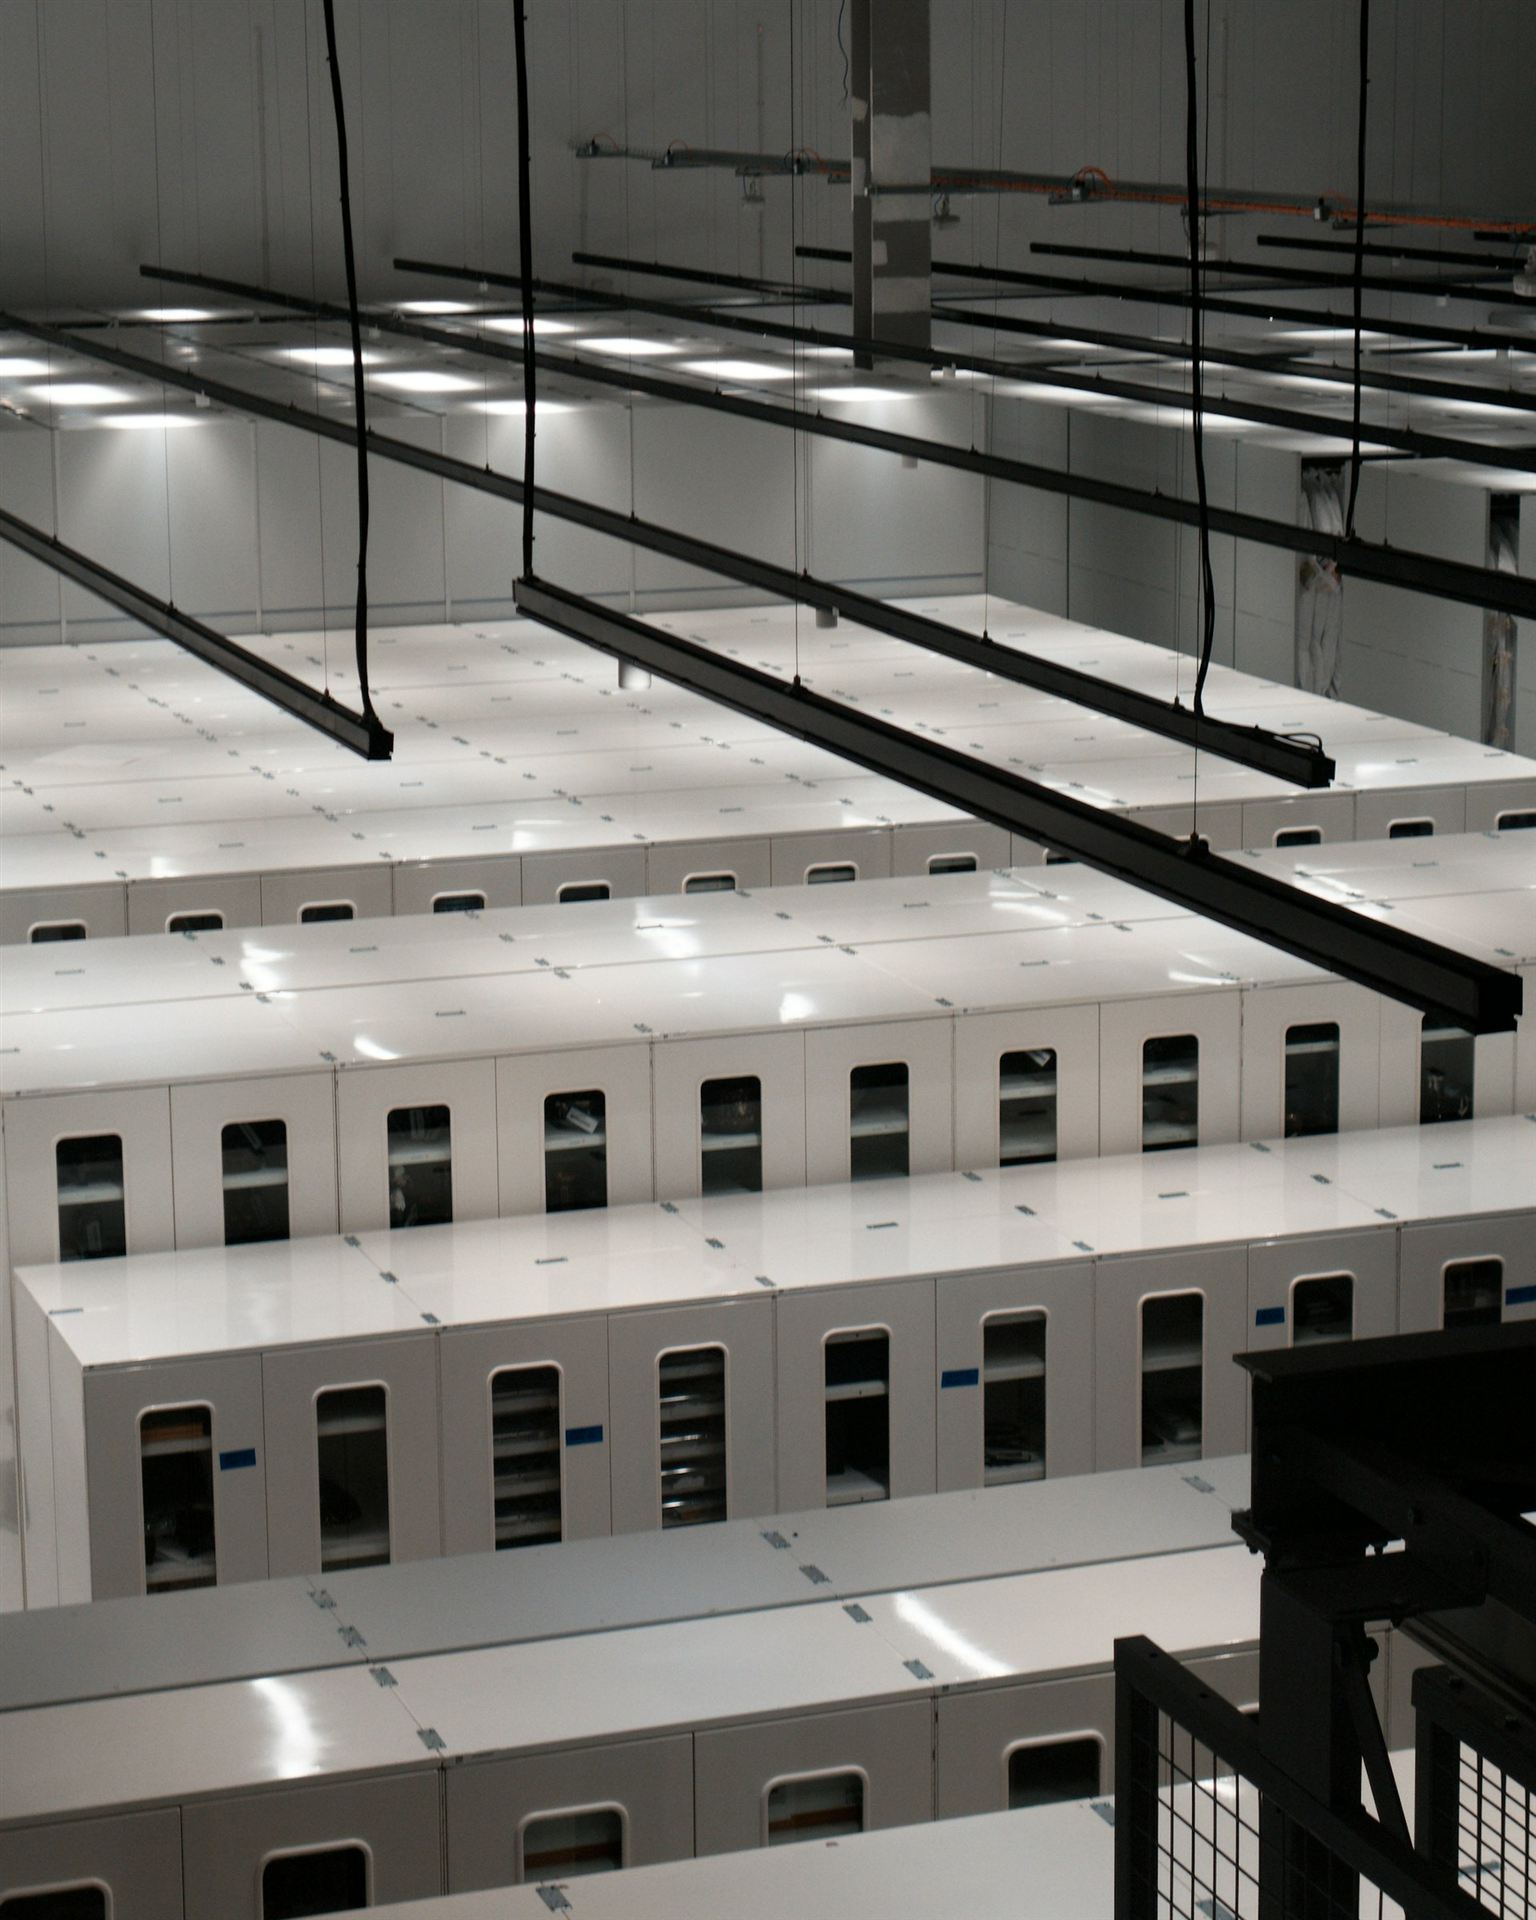 Data Centers · IllustrativeHyperscale Data Hall Commissioning ControlsReady for service meant Level 5 testing done, not a finished building. We scheduled every hall to that standard.
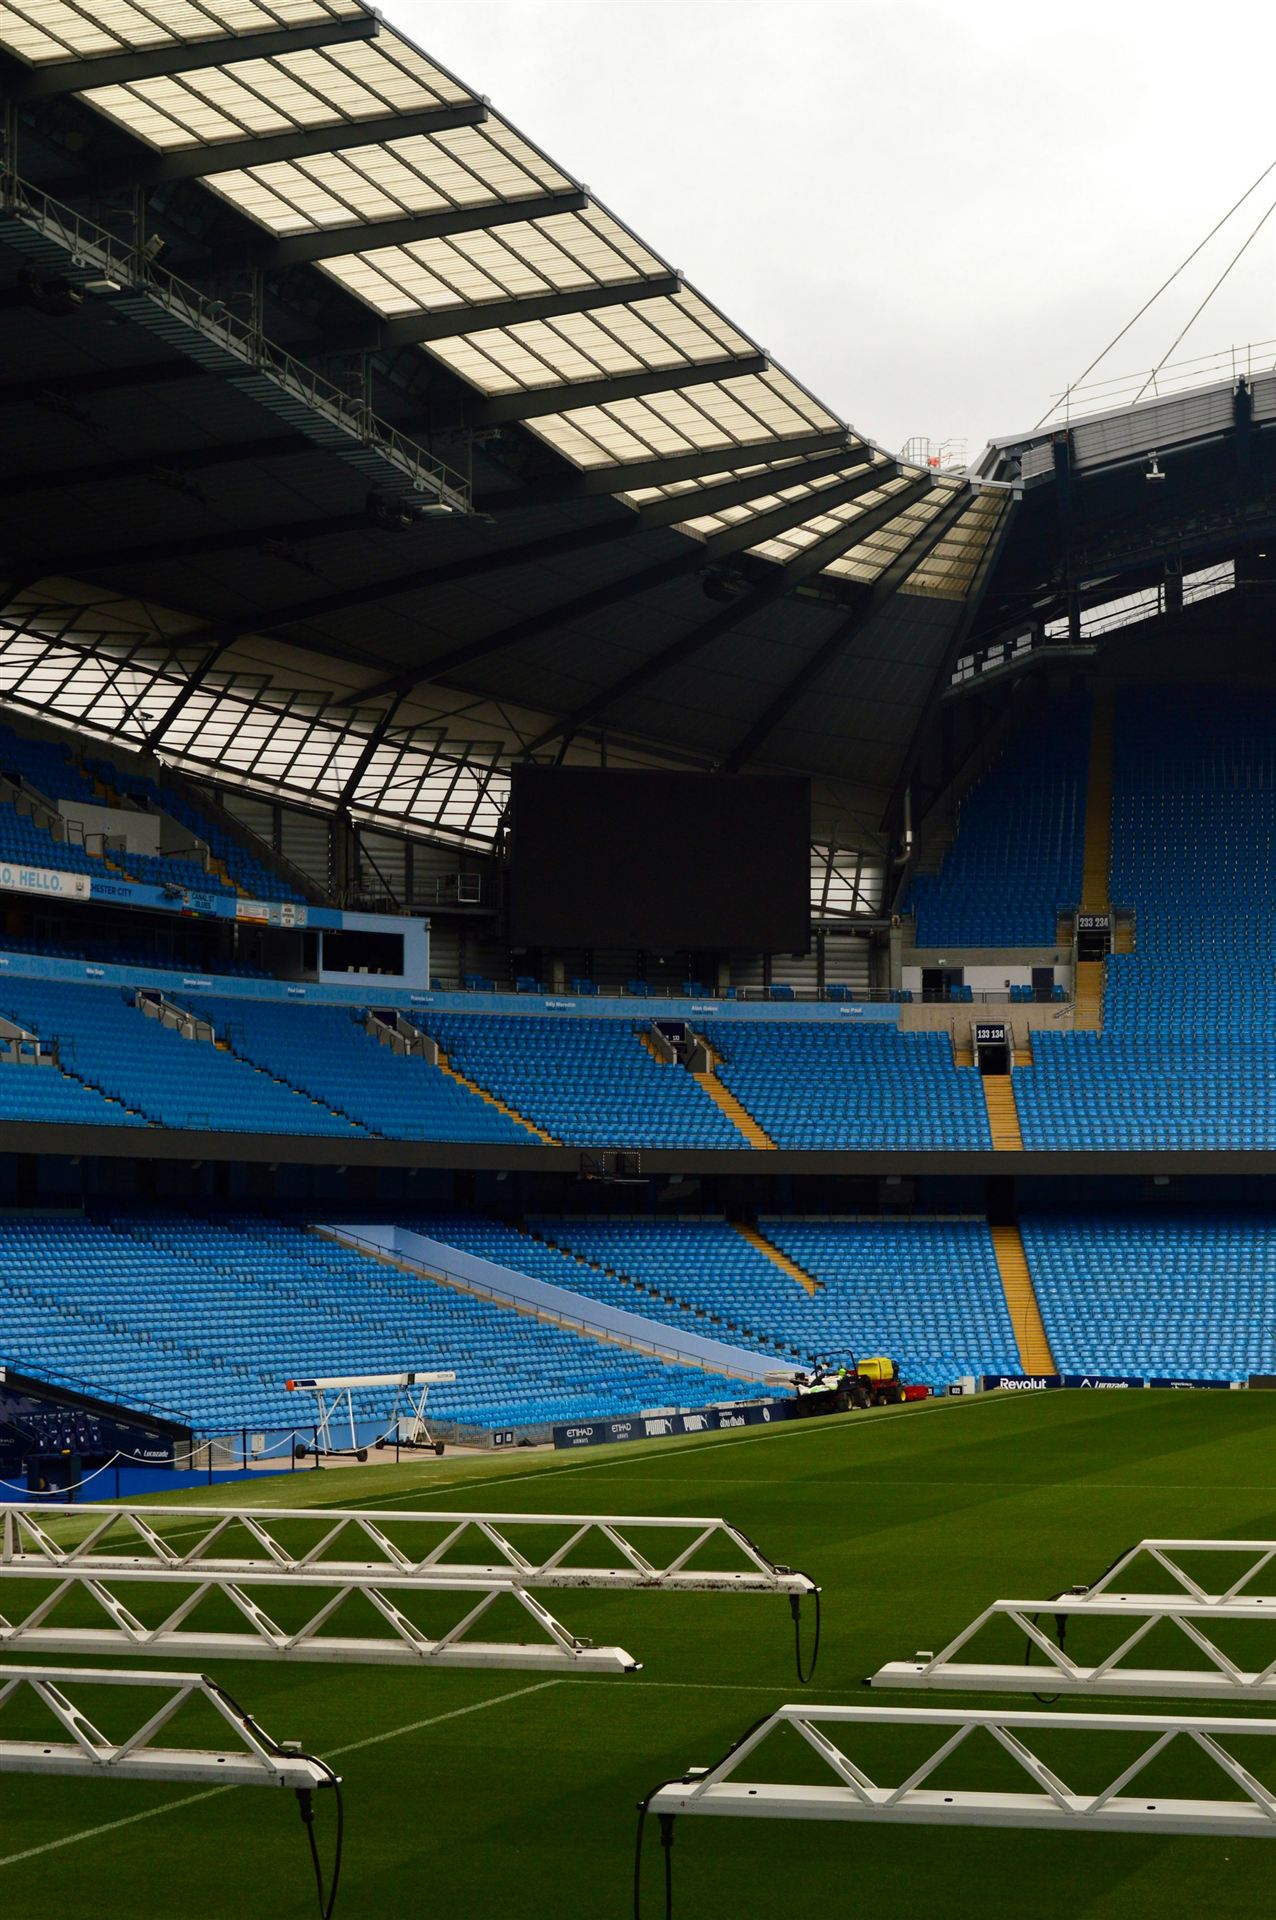 Sports & Entertainment · IllustrativeCollegiate Arena Off-Season RenovationTwo off-seasons to renovate a busy arena, with the home schedule fixed. The building was ready for the first game both years.
Straight answers to fair questions.
Longest path or total float?
Both. Longest path shows what drives the finish through calendars and constraints. Total float shows the margin across the network.
Can there be more than one critical path?
Yes, especially with several contract milestones. We show the driving path to each one separately.
How often should this be done?
Every update period, and any time a significant delay or change hits the work.
Can I watch float absorb a delay?
The Delay Impact Simulator in our Controls Lab shows it on a sample network.
Related services.

Send the schedule. Act while you have options.
Share the project, the latest XER and the date you are protecting. We will tell you plainly what the schedule is telling you.