

COD is where the money starts.
Interconnection dates, transformer deliveries and the commercial operation date decide the economics. Beck Franklin keeps those drivers in the logic, so a late delivery shows its effect on COD the week it happens.
Where energy projects miss COD.
What goes wrong with time and cost in this market, usually long before anyone reports it.
Interconnection is outside your control
Backfeed, testing and energization depend on the utility. When those dates are typed in, not linked, the COD forecast cannot be trusted.
Major equipment travels far
Main power transformers, breakers, inverters, modules and batteries travel long supply chains with little room for delay.
Weather and access are guessed
Wind, rain and ground conditions affect production. Schedules that ignore them carry hidden risk until the season turns.
What we watch every update.
- 01
Interconnection path
Utility work, backfeed, relay testing and energization carried as logic with predecessors, never as typed dates.
- 02
Transformer and major equipment
Order, fabrication, factory test, shipping and set dates tied to the work they feed, site by site.
- 03
Production against plan
Piles, racking, foundations or turbine erection measured against plan, so a falling rate shows its effect on COD.
- 04
The milestones at risk
Backfeed, mechanical completion, energization and commercial operation, each reported with remaining float.
The services that fit here.
The 4 services owners and contractors in power & renewables use most.
A risk-adjusted COD with interconnection and equipment risk modeled, ready for owners, lenders and investors.
A clear read of whether each site is driven by the utility, the equipment or field production, every update.
Earned value and cost reporting built for owners and financing partners, traceable to the native schedule file.
Clear analysis when equipment, utility work or changes push COD and someone has to carry the cost.
Related projects.
Every project is confidential. Names describe the work, regions stay broad and images are illustrative.
 Illustrative · Power & Renewables · Completed 2025Utility-Scale Solar and Storage BaselineU.S. Southwest · EPC
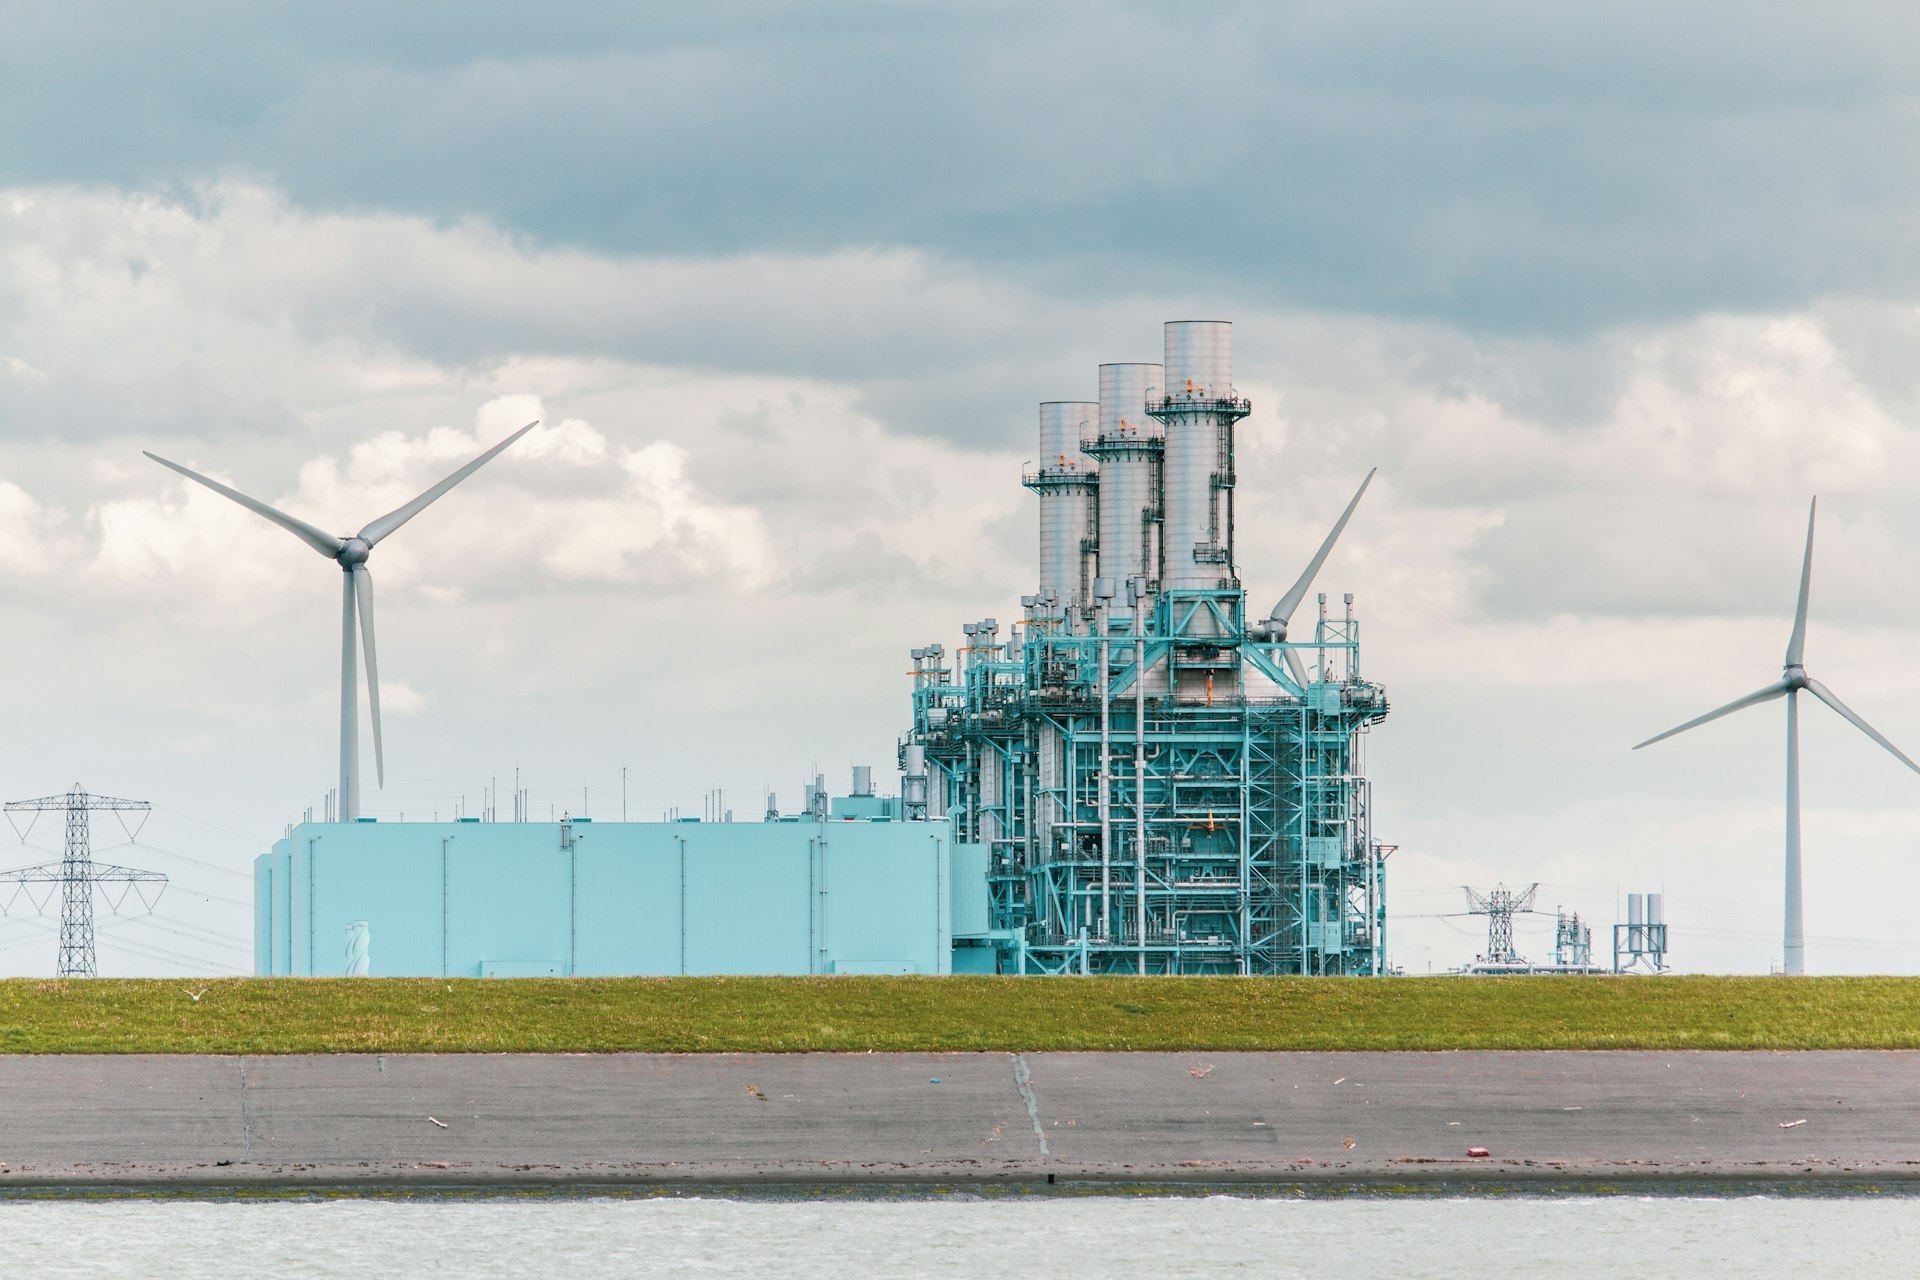 Illustrative · Power & Renewables · In progressGas Peaking Plant Schedule ReviewU.S. Midwest · EPC
 Illustrative · Oil, Gas & Chemicals · Completed 2024Chemical Plant Turnaround ScheduleU.S. Gulf Coast · EPC
Straight answers to fair questions.
Can you schedule a multi-site portfolio?
Yes. Each site gets its own schedule, rolled into one portfolio view so shared risks and shared equipment show up early.
Do you report to lenders and investors?
Yes, with the owner’s approval, using reports that trace back to the native schedule file.
Is there a better rate for repeat sites?
Yes. Similar sites and substations suit a highly discounted Program Rate, because the logic and reports are already built.

Show us the milestone you are protecting.
Send the power & renewables schedule and the date everyone is watching. Beck Franklin will tell you what is driving it and where you still have options.