



One page leaders read and act on.
Executive reporting and dashboards built from the schedule and cost data, not retyped from them. Milestones at risk, float trends, SPI and CPI, EAC and the decisions needed this month, on one page that ties back to the detail.
Leaders hear about it last.
Green until it is red
Status colors stay green until the month a milestone fails, when every option left is an expensive one.
Reports built by hand
Numbers retyped from P6 and the cost system into slides. They arrive late and disagree with the source.
Detail without a decision
Thirty pages of charts and no clear ask of the people who could act on them.
How we build reporting.

- 01
Start from the decisions
We ask what leadership decides each month, then design the report around those decisions.
- 02
Pull from the source
Dashboards fed directly from P6 and cost data, so the numbers match the files every time.
- 03
Trends over snapshots
Milestone float, SPI, CPI and EAC shown over time, because direction matters more than a single reading.
- 04
Days and dollars, not colors
Float and variance stated in numbers, with thresholds that trigger a named action.
- 05
Every figure traceable
Each number on the page ties to the activities and cost codes underneath it.
What you walk away with.
Scoped to your project. Native files and plain-English outputs that stay yours when we leave.
Milestones, float, cost, risks and decisions needed, on a single page.
Schedule and cost measures, filterable by project, area or contractor.
Every project on one screen, measured the same way.
What each measure means and how it is calculated, so nobody argues about the math.
A short narrative and exhibits for boards, lenders and funding agencies.
When to call us.
The earlier we see the schedule, the more options you keep.
Reports take a week
Your team spends more time assembling reports than reading them.
The board was surprised
A slip reached leadership before the report did.
No common view
Every project reports differently, so nothing can be compared.
Outsiders want evidence
A lender or agency needs reporting that will stand up to questions.
Where this work has run.
Every project is confidential. Names describe the work, not the client.
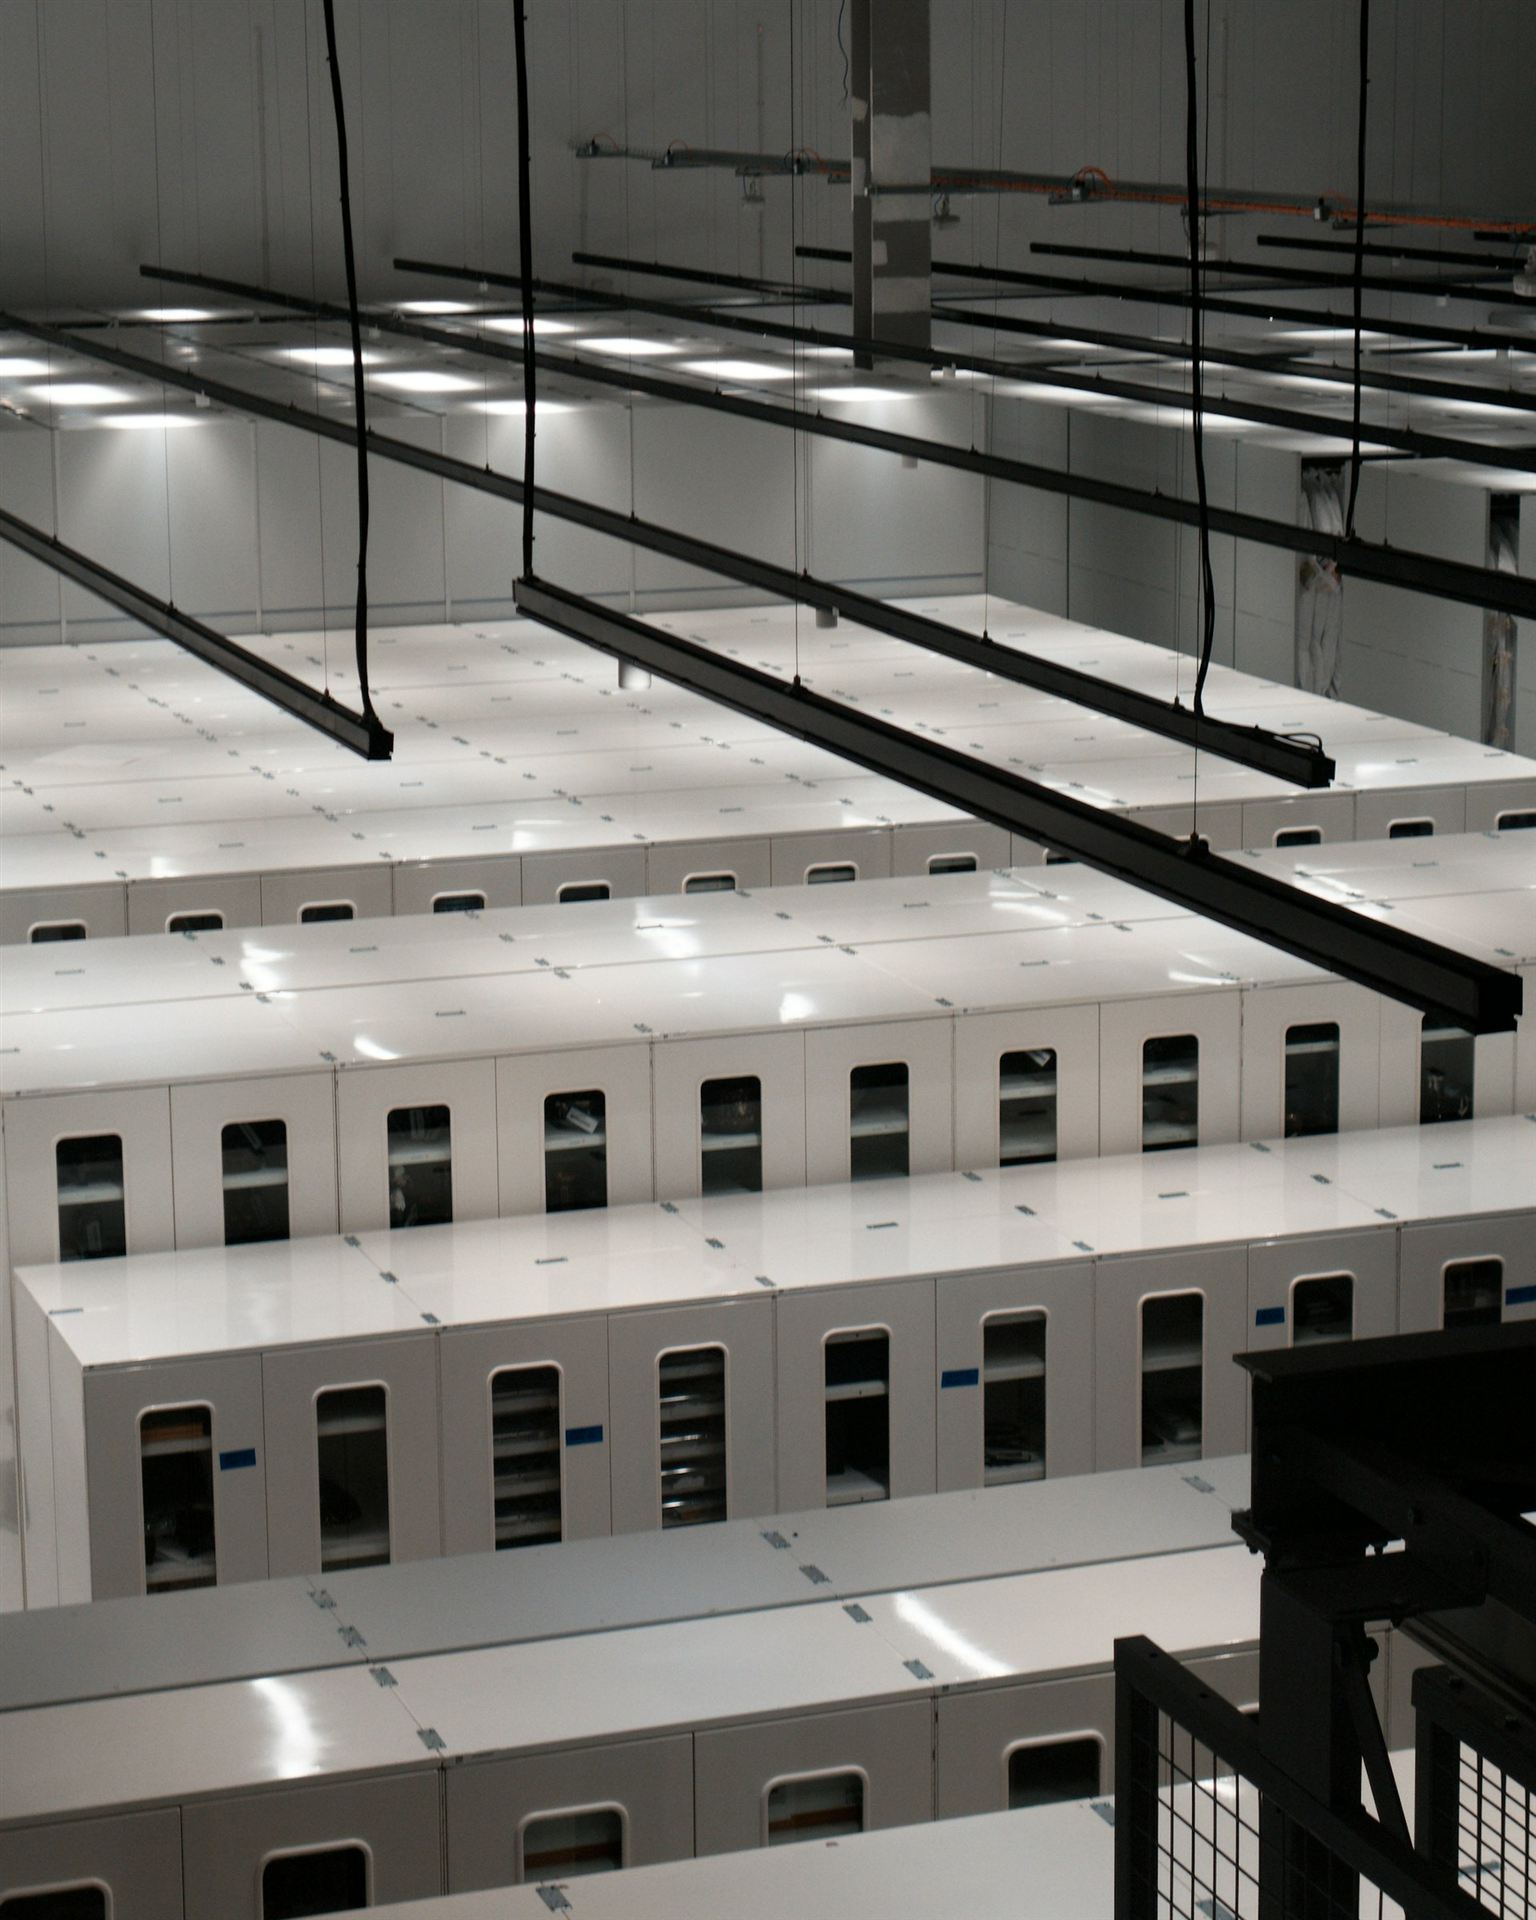 Data Centers · IllustrativeHyperscale Data Hall Commissioning ControlsReady for service meant Level 5 testing done, not a finished building. We scheduled every hall to that standard.
 Life Sciences · IllustrativeBiologics Manufacturing Suite RecoveryValidation was planned as one late block that nobody could measure. We split it into steps the team can track every week.
 Hospitality · IllustrativeResort Hotel Renovation PhasingRooms came out of inventory in blocks that matched the booking curve. Peak season was never touched.
Straight answers to fair questions.
What tools do you use?
Where possible, the tools you already have, including Power BI and Excel, fed from P6 and your cost system.
Will this replace our monthly report?
Usually it shortens it. The detail stays available. The front page gets sharper.
Can it include contractor schedules?
Yes, if they follow a coding standard. We can write that standard into the contracts.
How long does setup take?
It depends on how clean the source data is. We check the data first and then give you a timeline.
Related services.

Send the schedule. Act while you have options.
Share the project, the latest XER and the date you are protecting. We will tell you plainly what the schedule is telling you.